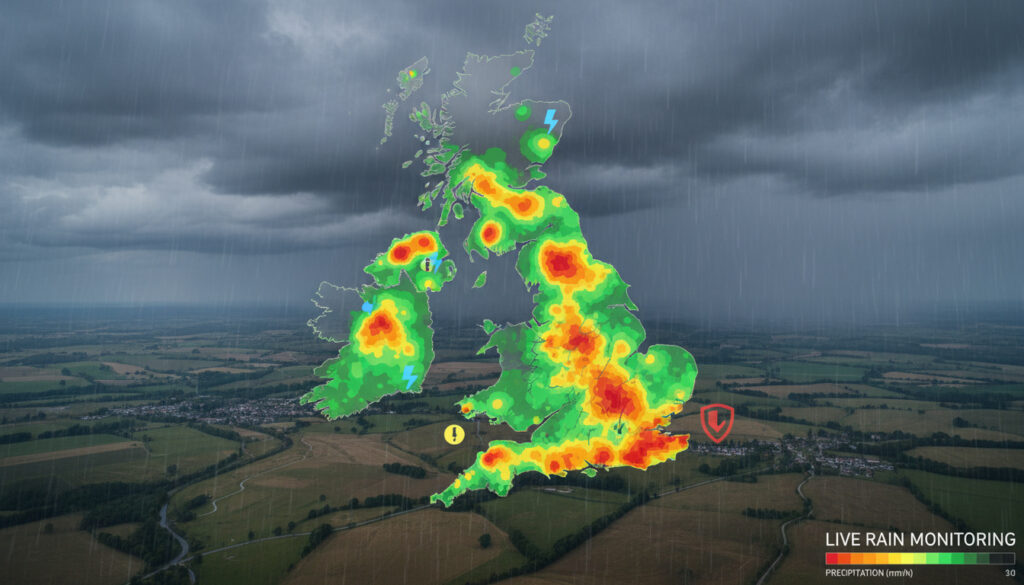
Met Office Rain Radar – Live UK Rain Maps and Alerts
Introduction
The Met Office maintains one of the most sophisticated rainfall radar networks in Europe, delivering real-time precipitation data that underpins modern British weather forecasting. From monitoring sudden downpours over the Pennines to tracking frontal systems approaching Cornwall, this infrastructure operates continuously, updating every five minutes with resolution sufficient to distinguish individual convective cells. The resulting imagery shapes everything from commute decisions to emergency flood responses across the United Kingdom.
The Operational Grid
Fifteen permanent installations constitute the operational grid, each housing C-band Doppler radar capable of penetrating moderate precipitation while resolving velocity characteristics. These network of C-band Doppler radar installations sample the atmosphere across multiple elevation angles, creating composite images through sophisticated algorithms that filter ground clutter and anomalous propagation. The system achieves 1-kilometre horizontal resolution across the British Isles and surrounding coastal waters, with particular density of coverage over England and Wales where population density demands higher precision. Data assimilation occurs automatically, feeding into the Met Office’s Unified Model alongside satellite observations and ground-based weather stations. Meteorologists accessing weather forecasting methods recognize this radar grid as the empirical foundation for nowcasting—predicting conditions zero to six hours ahead.
Key Insights
Effective interpretation requires understanding what the radar actually detects. The system transmits microwave pulses at approximately 5.6 GHz, measuring returned signals that indicate precipitation intensity through reflectivity. However, the radar beam rises with distance from the transmitter due to Earth’s curvature and standard elevation angles, potentially overshooting low-level precipitation far from the site. Conversely, bright banding—enhanced reflection where snow melts into rain—can exaggerate apparent intensity at the freezing level. Hail presents another complexity, as ice cores produce higher reflectivity than raindrops of equivalent size, occasionally misleading algorithms into overestimating liquid water content during severe thunderstorms.
Technical Specifications
| Parameter | Specification |
|---|---|
| Radar Band | C-band (5.6 GHz) |
| Pulse Repetition Frequency | 300-1200 Hz |
| Update Interval | 5 minutes |
| Spatial Resolution | 1 km composite |
| Maximum Range | 255 km per site |
| Polarization | Dual-polarization (since 2018) |
| Data Latency | Approximately 5 minutes |
Operational Details
Beyond intensity mapping, modern Doppler processing extracts precipitation velocity relative to the radar site, revealing wind patterns within storm systems and identifying convergence zones where thunderstorms might develop. The observational infrastructure underwent significant modernization with dual-polarization upgrades completed across all operational sites by 2018. This technology transmits both horizontal and vertical polarization states, allowing hydrometeor classification algorithms to distinguish between rain, snow, hail, and mixed-phase precipitation. Such discrimination proves crucial during marginal winter events when surface temperatures hover near freezing, determining whether precipitation reaches the ground as rain, snow, or freezing rain—a distinction with significant implications for transportation and infrastructure.
Network Evolution
The United Kingdom’s radar meteorology programme began with experimental installations in the 1970s, transitioning to operational status through the 1980s. The 1990s computerization replaced analogue photographic recording with digital signal processing, enabling real-time data distribution. Doppler capability arrived in 2005, adding velocity measurements to intensity data. The 2014 upgrade established the current 1-kilometre resolution standard, replacing the previous 5-kilometre product. Contemporary development focuses on clutter suppression algorithms, particularly challenging in coastal locations where anomalous propagation during temperature inversions produces false returns from distant terrain. The meteorological research division continues refining quality-control procedures to remove non-meteorological echoes while preserving weak precipitation signals.
Interpretation and Clarity
Public accessibility of radar data carries important caveats. The Met Office rainfall radar visible on mobile applications represents post-processed composites rather than raw observations. Terrain blockage creates shadows where precipitation may be underestimated, particularly west of major upland areas where radar beams encounter the Pennines or Scottish Highlands. Furthermore, the temporal resolution means rapidly developing thunderstorms may intensify significantly between five-minute scans, explaining why flash flood warnings occasionally precede apparent radar confirmation of extreme rainfall. Users interpreting these images should recognize that radar detects precipitation aloft, not necessarily reaching the surface, particularly when viewing distant echoes or virga—rain that evaporates before landing.
Meteorological Analysis
Integration of radar data with numerical weather prediction models has transformed short-term forecasting. The UK rainfall data provides continuous validation for high-resolution model outputs, closing the gap between algorithmic projections and atmospheric reality. During convective summer events, when small-scale thunderstorm development challenges even kilometer-scale models, human forecasters rely heavily on radar trends to extrapolate storm tracks and intensities beyond computational forecasts. Analysis of UK weather patterns reveals that radar-derived precipitation estimates now form critical input for hydrological models predicting river levels, demonstrating how atmospheric observation directly influences flood risk management and water resource planning.
Expert Perspectives
Radar remains our most valuable tool for nowcasting—predicting conditions for the next few hours. The shift to dual-polarization transformed our ability to distinguish precipitation types, particularly during marginal snow events where temperature profiles determine whether roads become treacherous or merely wet.
— Senior Operational Meteorologist, Met Office
Summary
The Met Office rain radar network represents sophisticated atmospheric observation infrastructure, translating electromagnetic signals into actionable weather intelligence through fifteen coordinated installations. While inherent limitations exist regarding beam geometry, terrain blockage, and temporal resolution, the continuous 1-kilometre coverage provides empirical data essential for contemporary meteorology. Understanding these technical parameters enables appropriate interpretation of radar imagery, recognizing both its predictive power and constraints when making decisions based on precipitation forecasts.
Frequently Asked Questions
How often does the Met Office rain radar update?
The network generates new composite images every five minutes, with approximately five minutes additional latency for data processing and quality control before public availability.
Why does radar sometimes miss light rain?
Radar beams angle upward with distance from the installation, potentially overshooting low-level precipitation, while drizzle produces weak reflectivity signals that may fall below detection thresholds, particularly distant from radar sites.
Can I access raw Met Office radar data?
Processed imagery and animations are freely available through the Met Office application and website, while raw level-II data requires specialized meteorological licenses typically held by research institutions and commercial weather providers.
What do the different colours on radar maps indicate?
Colours represent precipitation intensity measured in dBZ (decibels relative to Z), with blue and green indicating light precipitation, yellow and orange moderate rainfall, and red or purple depicting heavy downpours or hail.
Why does rain sometimes show on radar but not reach the ground?
Radar detects precipitation aloft, which may evaporate before reaching the surface, particularly during dry atmospheric conditions or when viewing distant echoes where the beam samples high altitudes.
More related posts
 Tamzin Outhwaite: Biography, Children, Movies, Family Connection
 Jeremy Kyle: From Cancellation to Comeback (2026)
 Karl Darlow: Age, Nationality, Clubs, Salary & Grandfather
 Shubman Gill: Age, Relationship, Health, Stats & Net Worth
 Gold Necklace Gold: 14k, 18k & 24k Buying Guide
 Sk Sturm Graz vs Nottm Forest – 0-0 Draw, Stats & 1984 History
 The Madame Blanc Mysteries Season 5 Renewal & Filming
 Kyle Clifford: Crossbow Killer Sentenced for Hunt Family Murders